System Overview
ARGUS is structured as a layered system: instrumentation at the bottom, detection in the middle, and presentation at the top. Each layer is independent — you can add custom validators, extend detection, or build your own tooling on top of the trace API.
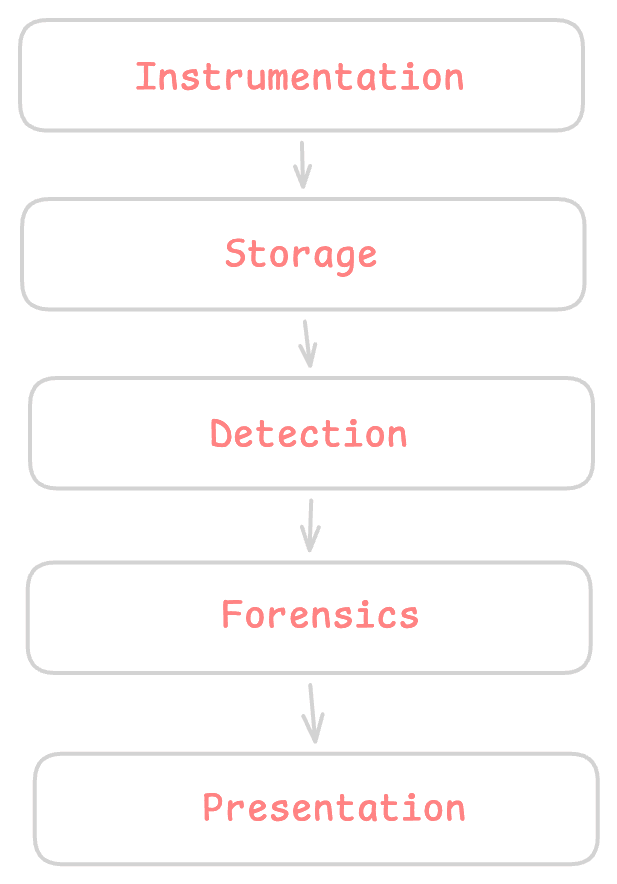
Data Flow
Here's what happens during a watched execution:
- Instrumentation— the Watcher patches the graph's node callbacks to intercept inputs and outputs at each step
- Execution recording — as the pipeline runs, each node creates a
TraceStepwith input state, output state, timing, and metadata - Detection — four layers run against the trace: heuristic engine, anomaly detector, correlator, and (when needed) LLM investigator
- Forensics — if detections are found and
investigateis enabled, the forensic analyzer traces the causal chain from symptom to root cause - Storage — the complete run (steps + detections + forensics + HTTP recordings) is written to
.argus/runs/ - Presentation — results are available via CLI, the web dashboard, or the Python API
Auto-save
Detection and storage happen when
invoke() / ainvoke() returns, including cyclic graphs. finalize() is optional and idempotent.Two Entry Points
ARGUS works with LangGraph pipelines and plain Python functions:
- ‣ArgusWatcher— for LangGraph pipelines. Hooks into the graph's execution callbacks automatically. Requires LangGraph 0.2+.
- ‣ArgusSession — for everything else. Works with plain Python functions, Prefect tasks, Temporal workflows, or any callable. No framework dependency.
python
# ArgusSession — no LangGraph needed
from argus import ArgusSession

session = ArgusSession()
session.set_edges({"fetch": ["classify"], "classify": ["process"]})

fetch    = session.wrap("fetch",    fetch_fn)
classify = session.wrap("classify", classify_fn)
process  = session.wrap("process",  process_fn)

state = fetch(initial_state)
state = classify(state)
state = process(state)
session.finalize()
Extension Points
- ‣Validators — pass custom validation functions via the
validatorsparameter for domain-specific checks. Use"*"to run on every node. - ‣Adaptive signatures — the LLM investigator proposes new heuristic patterns. Approve them in the Approvals page to extend the detection engine.
- ‣Linear integration — connect your Linear workspace from the Settings page. Reports create labeled issues with full diagnostics.